
ROI of Autonomous Electronics Assembly: Yield, Utilization, and Payback




A faster assembly cell can look compelling in a demonstration and still disappoint on the factory floor. The difference usually lies between nominal speed and dependable, saleable output. For executives evaluating the ROI of autonomous electronics assembly, labor savings are only part of the investment case. First-pass yield, equipment utilization, integration costs, and customer demand determine whether the projected return becomes cash.
The central purchasing question is not simply whether robots can assemble a product. It is whether the complete system can produce the required mix, at the required quality, with less economic waste than the current operation. That requires a financial model built around actual production conditions—not a supplier’s fastest cycle time.
Start with the production constraint, not the robot quotation
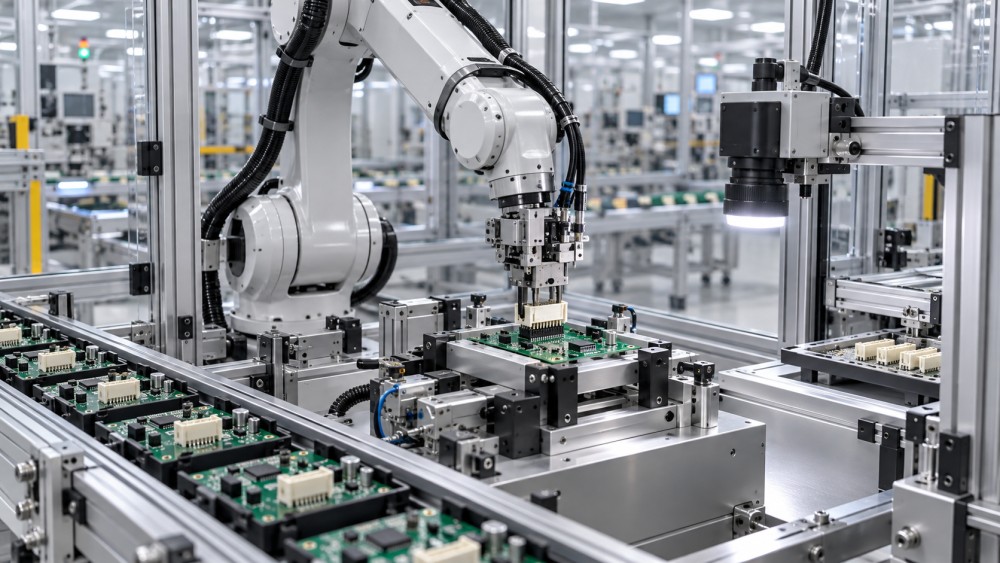
Autonomous electronics assembly can combine robotic handling, precision dispensing, screwdriving, connector insertion, machine vision, automated testing, and production-data feedback. The scope varies considerably. A self-contained robotic station and an integrated assembly-and-test line do not carry the same costs, responsibilities, or operating risks.
Before comparing quotations, identify the constraint that currently limits business performance. Is it inconsistent manual assembly, insufficient test capacity, high rework, operator availability, or lengthy product changeovers? Automating the wrong operation may improve one station’s efficiency without changing shipment volume.
Consider a line where connector insertion is slow, but functional testing already runs at capacity. Increasing insertion speed alone will create more work in progress. Unless testing capacity also changes, the financial benefit must come from reduced labor, lower defects, or improved scheduling—not additional sales.
A useful baseline therefore covers a representative product mix and operating period. Capture actual cycle times, downtime reasons, changeover duration, staffing, first-pass yield, rework hours, scrap costs, and shipments. Include difficult variants and ordinary disruptions. A baseline drawn only from stable, high-volume runs will make almost any automation proposal appear attractive.
How yield and utilization turn into financial value
First-pass yield: count avoided costs accurately
First-pass yield measures the share of units that complete the defined process without repair or rework. In electronics assembly, repeatable force control, calibrated dispensing, and vision-guided positioning may reduce defects such as damaged connectors, missing components, or inconsistent adhesive application.
However, better detection is not the same as better assembly. A new inspection system may initially lower reported first-pass yield by exposing defects that previously escaped. Buyers should distinguish defect prevention, defect detection, and final outgoing quality when comparing performance.
The economic benefit depends on where defects occur and what happens next. Preventing damage to an expensive, nearly finished assembly is worth more than avoiding a minor, easily corrected issue early in production. Estimate savings using actual material losses, repair effort, retesting, and other avoidable costs. Do not treat the full selling price of every rejected unit as a loss.
Utilization: distinguish available time from productive time
A cell can be powered on without producing useful output. Component replenishment, fixture cleaning, program changes, calibration, blocked downstream stations, and operator interventions all consume capacity.
Define utilization before using it in a business case. Some organizations measure running time against scheduled hours; others compare productive hours with total calendar time. These definitions produce very different percentages. For investment modeling, make the underlying losses visible:
- Scheduled hours: the production time the business actually plans to operate.
- Availability: the share of that time remaining after relevant stoppages and changeovers.
- Performance: actual operating speed relative to the validated ideal rate.
- Quality: the proportion of output meeting the chosen acceptance definition.
For a simplified first-pass capacity estimate:
First-pass good output = scheduled hours × ideal production rate × availability × performance × first-pass yield.
Keep these factors separate. If a utilization figure already includes speed losses or quality losses, multiplying by those factors again understates output. Equally, using final yield after repair in a first-pass model hides the capacity and cost consumed by rework.
Saleable output: capacity is not revenue
Additional capacity creates financial value only when it serves demand, replaces outsourcing, avoids overtime, or releases another measurable expense. A system capable of producing more units does not automatically generate more orders.
For additional sales, use incremental contribution rather than revenue. Deduct the variable costs required to make and deliver those units. Confirm that upstream supply, downstream testing, packaging, and customer demand can support the increase. Otherwise, the model values inventory accumulation as if it were profitable growth.
A worked ROI example—and the assumption that changes everything
The following figures are illustrative modeling assumptions, not industry benchmarks, supplier quotations, or promised results. Assume an existing operation and a proposed automated system each have 4,000 scheduled production hours annually and an ideal rate of 100 units per hour.
The modeled capacity gain is 60,570 first-pass good units annually. Suppose validated additional demand supports only 30,000 units, each generating $8 in incremental contribution after variable costs. The business should recognize $240,000—not the value of the entire theoretical capacity gain.
Now assume the following annual cash effects:
- $160,000 in realizable labor-related savings through avoided hiring, overtime reduction, or positions genuinely removed from cost.
- $60,000 in avoided scrap and rework spending on the production volume common to both options.
- $240,000 in contribution from additional sales.
- $100,000 in additional fixed operating expenditure for the automated system.
Annual net benefit is therefore $360,000. With a fully installed investment of $900,000, simple steady-state payback is 2.5 years. Annual net benefit divided by initial investment gives a simple annual return of 40%; this is not an internal rate of return.
Now remove the additional demand. Net annual benefit falls to $120,000, extending simple payback to 7.5 years. The equipment has not changed. The commercial assumption has.
This example also requires strict accounting boundaries. The quality savings exclude benefits already captured in incremental contribution. Additional fixed operating costs exclude variable expenses already deducted from the $8 contribution. Without these distinctions, the same benefit—or expense—can enter the model twice.
The installed price is only the beginning of ownership cost
A robot quotation rarely represents the complete investment. Procurement should reconcile a single installed-cost schedule across equipment suppliers, the integrator, facilities, IT, production engineering, and quality.
Include tooling, feeders, fixtures, end effectors, vision, testing interfaces, guarding, and safety validation. Add electrical work, compressed air where needed, electrostatic-discharge controls, facility modifications, software integration, training, initial spares, and production qualification. Product-specific requirements may also introduce traceability, cleanliness, or process-validation costs.
Recurring expenditure deserves equal attention. Maintenance contracts, software licenses, calibration, consumables, replacement tooling, specialist support, cybersecurity maintenance, and internal engineering effort can materially affect returns. Extended unattended operation may require automatic replenishment, fault recovery, and escalation systems beyond the original assembly scope.
Ask who owns the programs, configuration files, inspection recipes, and production data. Restricted access can increase the cost of future modifications and make an otherwise competitive purchase expensive to maintain.
Product mix and ramp-up deserve their own financial assumptions
High-mix electronics production tests automation differently from long, stable runs. Small changes in connector geometry, board layout, component presentation, or enclosure tolerances can require new tooling and process development. “Flexible” should therefore describe a demonstrated changeover capability, not simply a programmable robot.
Request the complete changeover sequence: mechanical adjustment, recipe loading, feeder changes, calibration, first-article inspection, and release to production. Ten minutes to load a program is not a ten-minute changeover if qualification takes another hour.
Ramp-up is another frequent blind spot. The worked example assumes steady-state performance, but installation, debugging, training, and yield stabilization can delay savings. Model cash flow by month during implementation and early operation. Include parallel production, temporary staffing, validation builds, and any planned interruption to existing output.
Redeployed labor is not automatically cash savings. Moving employees to another task may create valuable capacity, but the financial benefit must connect to avoided recruitment, additional contribution, or another measurable outcome. Retained supervision, replenishment, maintenance, and exception-handling labor must remain in the operating model.
Turn supplier claims into purchase acceptance criteria
A strong proposal should survive testing with representative products and realistic disruptions. For decision-makers, the most useful evidence is not a polished demonstration but a clear agreement on what successful operation means.
- Validate the mix: include difficult variants, realistic component tolerances, and representative material presentation.
- Measure sustained output: specify the test duration, staffing, replenishment requirements, and treatment of microstops.
- Define quality: agree on first-pass yield, false rejects, defect escapes, and the method for verifying results.
- Test recovery: observe responses to misfeeds, missing parts, failed inspection, and restart after interruption.
- Verify changeovers: measure time through production release, not merely recipe selection.
- Assign integration responsibility: document interfaces with testing, manufacturing execution systems, traceability, and existing controls.
Factory acceptance testing can reduce uncertainty, but site acceptance must confirm performance within the real production environment. Where commercially feasible, link payment milestones to agreed deliverables and measurable acceptance conditions.
Make the investment decision resilient, not merely attractive
Before approval, compare base, downside, and upside cases. Vary demand, availability, yield, implementation timing, and realizable labor savings independently. This reveals whether payback depends on one fragile assumption or several achievable improvements.
Simple payback is useful for screening, but it ignores the time value of money and benefits after the recovery point. Use net present value and, where appropriate, internal rate of return for the full decision. Include taxes, depreciation effects, working capital, later upgrades, and residual value consistently with corporate finance policy.
Through GIRA-Matrix’s industrial intelligence lens, the essential connection is between motion control, mechanical execution, and business outcomes. Precision matters when it reduces costly defects; autonomy matters when it sustains useful production; flexibility matters when it protects returns as the product mix changes.
The strongest ROI of autonomous electronics assembly is not the one with the most optimistic spreadsheet. It is the one supported by representative production evidence, complete ownership costs, credible demand, and acceptance criteria that hold suppliers—and internal assumptions—to account.
Got questions about this industry report or seeking customized analysis for your specific sector? Drop us a line below, and let the research experts at Indu Horizon Report help you out.
We respect your privacy. Your information is strictly confidential.
Related News
- How to verify supplier credentials on an industrial systems platformNov 10, 2026Use an industrial systems platform for supplier evaluation with confidence. Learn how to verify credentials, assess capabilities, and reduce sourcing risks.
- Can a process automation platform integrate with legacy systems?Nov 07, 2026Can a process automation platform integrate with legacy systems? Explore integration methods, security risks, and pilot strategies before you invest.
- How to evaluate a manufacturing digital transformation consulting firmNov 04, 2026Evaluate manufacturing digital transformation consulting firms with confidence. Compare delivery evidence, plant expertise, integration risks, costs, and measurable outcomes.